
Hi, and there’s a tremendous cost we need to talk about…
Most investors don’t realize the actual cost, and for the ones who do, it’s often long after the fact.
Timing the market can be an expensive game to play – and the cost may shock you.
As one example, if you happen to time selling *out* of the market correctly, you still have to do one more critical thing correctly to have that trade actually be profitable. You have to buy back in below where you sold out (and almost no one has the stomach to do that!)
Otherwise, you’ve already lost money!
And yet, so many investors (read: gamblers) try to ‘time’ the market. The effect, truly the aftermath of trying to time the market can be profoundly negative.
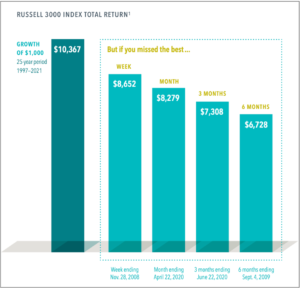
Research shows that over a 25-year period, if you cashed out for only the five-best performing days (which occurred in November 2008), you would have cost yourself over 14% of the cumulative 25-year return.
If you missed the best three months, which ended June 2020, you would have cost yourself approximately 27% of the same 25-year return.
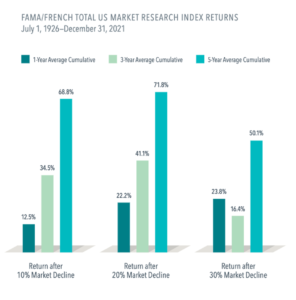
In fact, five years after market declines of 10%, 20% and 30%, the cumulative returns all top 50%.
Our research shows that 73% of the time, returns on stocks were positive two years after a recession began.
Data shows us that staying invested is crucial to your long-term investment growth.
If you invested $1,000 in U.S. stocks in 1970 without cashing out at any point, your investment would likely be worth $121,353 based on average S&P returns over that 50-year period.
But, what if you missed the best-performing day during that time? That same investment would be worth around $108,758.
What if you missed the five best-performing days? That investment value drops to $77,056.
The fifteen best-performing days? $43,472.
You can see the value of staying invested. You can also see how much trying to ‘time the market’ can cost you and your financial future.
We’re repeating the most important point here – the biggest challenge with timing the market is you have to be right twice – once when you sell, and again when you try to buy back in.
So, why would someone like yourself feel pressured to ‘time the market’? Maybe it’s because your friends and coworkers are doing it.
Maybe it’s because the news pundits are recommending it.
Maybe it’s because you have big dreams and want to know your financial means will be there to support your dreams well into the future.
Maybe it’s because you’re not certain you have the right plan in place to create the future you crave.
If that sounds far too familiar, economic times like these are what can cause those concerns to shake awake.
If you’re in that place, hit reply to this email and let us know what’s on your mind. Our team reads every response – and we’re here to help you find the support you need.
To your prosperity,
Your Hendershott Wealth Management team
- In US dollars. For illustrative purposes. Best performance dates represent end of period (Nov. 28, 2008, for best week; April 22, 2020, for best month; June 22, 2020, for best 3 months; and Sept. 4, 2009, for best 6 months). The missed best consecutive days examples assume that the hypothetical portfolio fully divested its holdings at the end of the day before the missed best consecutive days, held cash for the missed best consecutive days, and reinvested the entire portfolio in the Russell 3000 Index at the end of the missed best consecutive days. Frank Russell Company is the source and owner of the trademarks, service marks, and copyrights related to the Russell Indexes.
- The average annualized returns for the five-year period after 10% declines were 9.54%; after 20% declines, 9.66%; and after 30% declines, 7.18%.
Past performance is no guarantee of future results. Short-term performance results should be considered in connection with longer-term performance results. Indices are not available for direct investment. Their performance does not reflect the expenses associated with the management of an actual portfolio.
Market declines or downturns are defined as periods in which the cumulative return from a peak is –10%, –20%, or –30% or lower. Returns are calculated for the 1-, 3-, and 5-year look-ahead periods beginning the day after the respective downturn thresholds of –10%, –20%, or –30% are exceeded. The bar chart shows the average returns for the 1-, 3-, and 5-year periods following the 10%, 20%, and 30% thresholds. For the 10% threshold, there are 29 observations for 1-year look-ahead, 28 observations for 3-year look-ahead, and 27 observations for 5-year look-ahead. For the 20% threshold, there are 15 observations for 1-year look-ahead, 14 observations for 3-year look-ahead, and 13 observations for 5-year look-ahead. For the 30% threshold, there are 7 observations for 1-year look-ahead, 6 observations for 3-year look-ahead, and 6 observations for 5-year look-ahead. Peak is a new all-time high prior to a downturn. Data provided by Fama/French and available at mba.tuck.dartmouth.edu/pages/faculty/ken.french/data_library.html. Eugene Fama and Ken French are members of the Board of Directors of the general partner of, and provide consulting services to, Dimensional Fund Advisors LP.
FAMA/FRENCH TOTAL US MARKET RESEARCH INDEX 1926—present: Fama/French Total US Market Research Factor + One-Month US Treasury Bills. Source: Ken French website.
Investing risks include loss of principal and fluctuating value. There is no guarantee an investment strategy will be successful.
Investment products: • Not FDIC Insured • Not Bank Guaranteed • May Lose Value